The joys of extracting data from geoscientific papers
I am in the process of revising a recent discussion paper I have published on the tectonic evolution of the South Atlantic rift system. So I started to collect some information from various papers to back up and supplement an alternative plate tectonic scenario. Unfortunately there only one or two key papers on this remote offshore region on the Argentine margin (not a prolific basin to drill for hydrocarbons), so what I usually do in that case is to take a screenshot of the relevant maps in that paper and georeference them. Once this is done, one can add extra information into the files I am using in GPlates for my reconstructions.
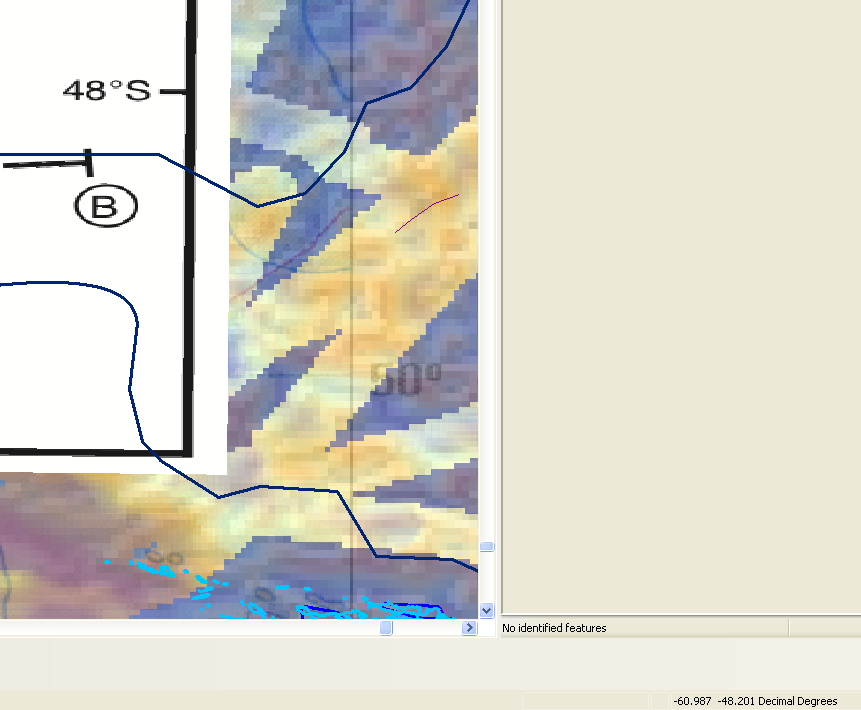
As geoscientists sometime do excel in trying to even make published data hard to use (I mean if you are mapping geospatial features, is there ANY reason to disguise your work in a low-resolution raster graphics depicting a map in a very odd projection without any information about the projection or its location so that no one can really USE it - apart from reading the paper?). Sometimes (oftentimes) there is, apparently, as I am about to find out. So in this case, we have an overview map with a set of offshore seismic lines indicated. While this overview map has national and international boundaries and a coastline, it misses a graticule, but through the coastline and the international boundaries it still can be georeferenced adequately. Here is the georeferenced image of the overview map:
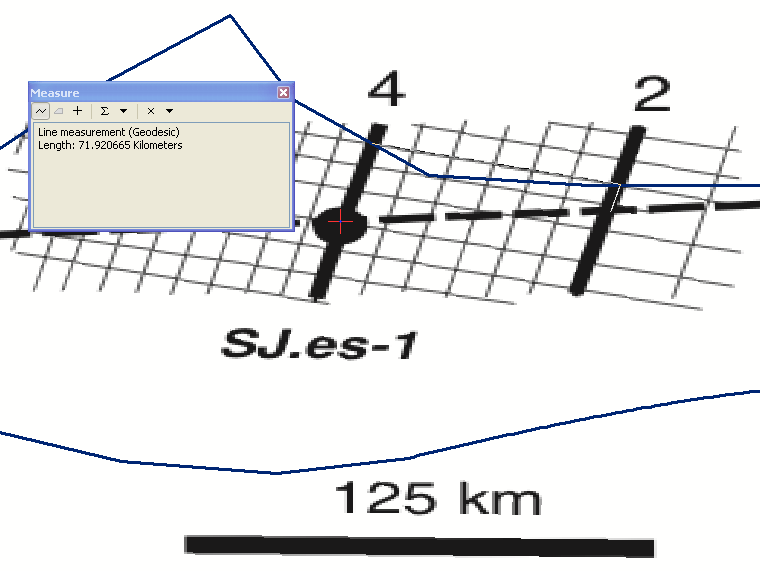
The map I am interested in covers the offshore seismic grid around the SJ.es-1 well, and shows the tectonic inventory of the San Julian Basin offshore Argentina. It is in a different projection than the overview map (going by the map frame annotation) and has no geographical features which can be used for georeferencing apart from the well and the 2 seismic line locations SL2 and SL4. Easy, I hear you say, two beautifully straight lines, and a point, what more do you need? Have a look at the map scale from the first image above. Based on that image, the lines are about 75 km long and about 70 km apart, measured on the seismic grid:
Now, we have a look at the structural map a bit more in detail - different projection most likely going by the frame annotation (no information given in figure caption), no other georeferencable features such as coastlines or boundaries. But was we also see is that the seismic lines are spaced about 40 km apart at their closest distance, not really parallel and latitudinally offset. There are a few reasons why this could be - two I can think of right away: the different projection compared to the overview map or the actual lines shown could be a subset of the full lines. Here is the image:
Next, we're going to georeference the structural map with the information contained in both maps, namely the two seismic lines and the well. Even though the projections might differ this should not be too hard:
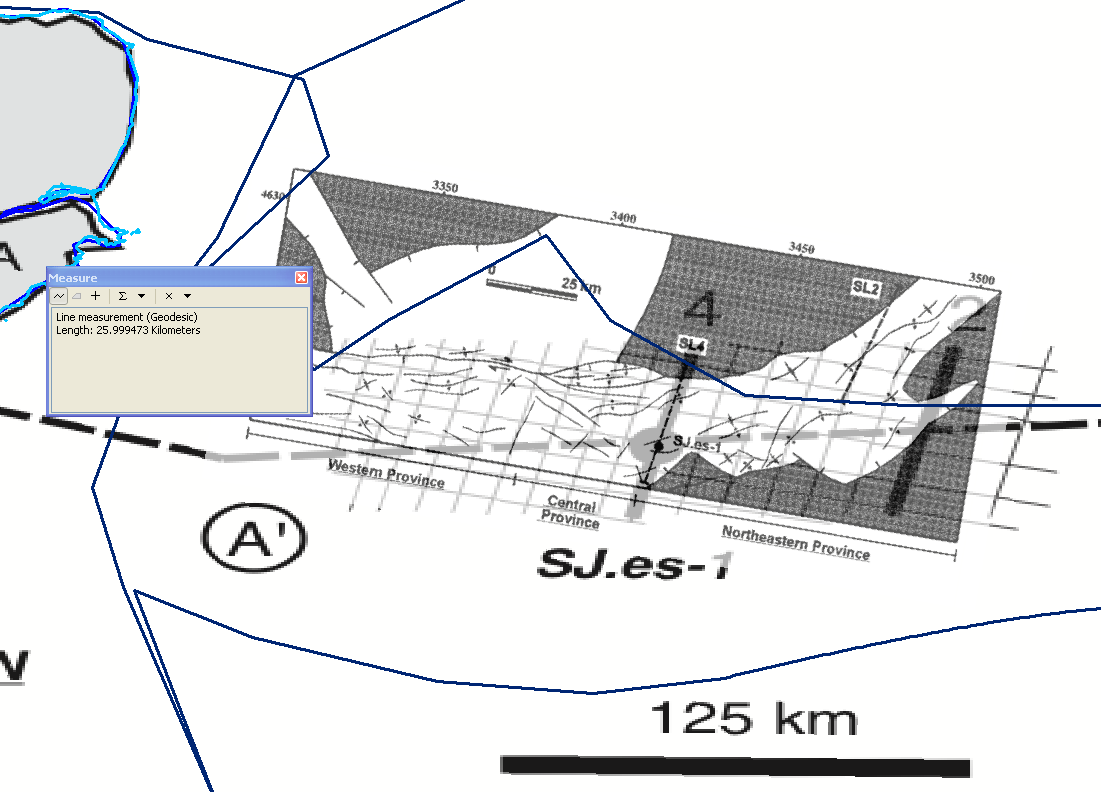
When the seismic line end points are used the map is scaled and rotated. While seismic line 4 seems to match reasonably well and we also do get a relatively good match with line 2, we can see that the map scale is still close to double the stated scale (49 km in the georeferenced version vs. 25 km stated on map). Ok, next try:
This time, I scaled the map to match the length scale (25.9km vs 25 km stated in the map) and then rotated the image with the SJ.es-1 well as control point. So it seems that the overview map does not show the correct information - either the lines are wrongly indicated (ie not full length, not the right lines), or the line locations on the structural map are wrong. Simply, there is no (easy and straightforward) way to get the line locations in the overview map to match those in the strutural map which is a basic breakdown of scientific reproducibility… Sadly this means that the information in the structural map cannot be utilised by other people (like me) who try use it. I can understand -to a degree- that geoscientists have a tendency to obscure their data by chosing map projections which make it harder to reverse engineer the information contained in the maps. But there is a difference between publishing a “hard to reverse-engineer” map and a plainly wrong map.


