meta data for this page
The world in (geological) colors
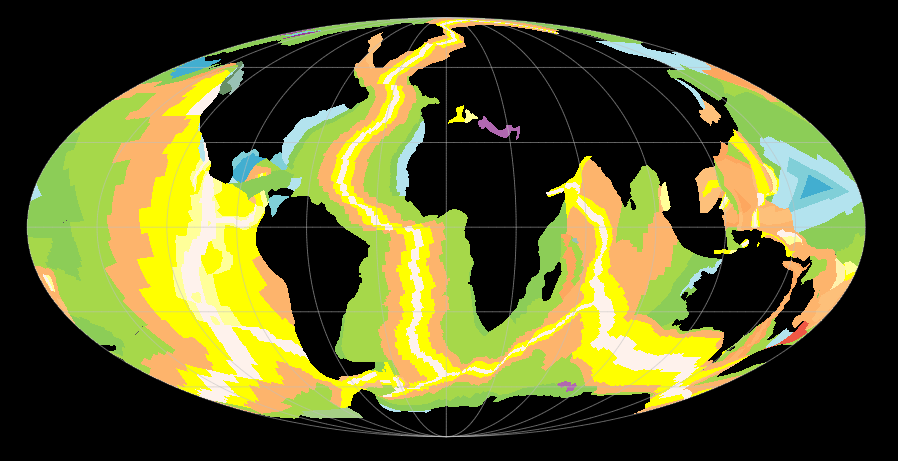
The color palettes I described in my recent post can also be used with GPlates to color loaded features. Here are three examples which use the static polygon dataset which comes with GPlates. The first is using the GTS2012 chronostratigraphic time scale to color the static polygons by epoch and fill the polygons:
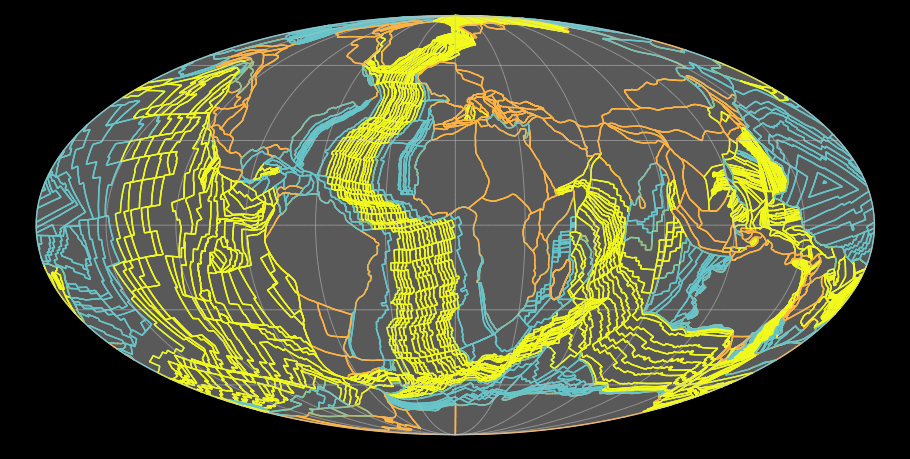
The second is just using the same data set and color the line features by geological era:
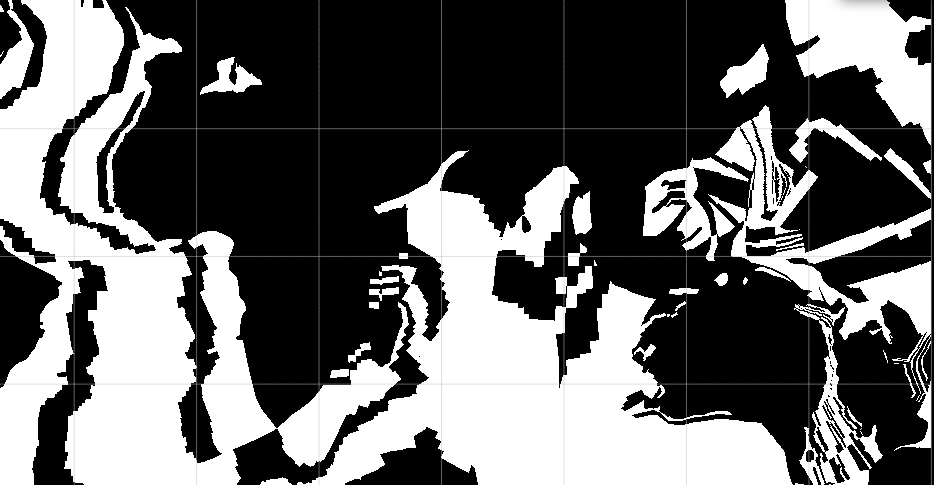
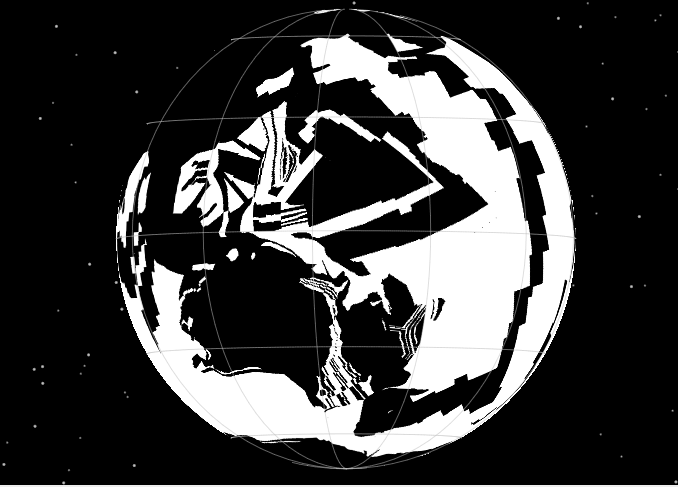
And the last is a bit Bauhaus-y by coloring everything in black and white according to the Gee & Kent geomagnetic polarity time scale (not that this would make a lot of sense, but as we can do it…):
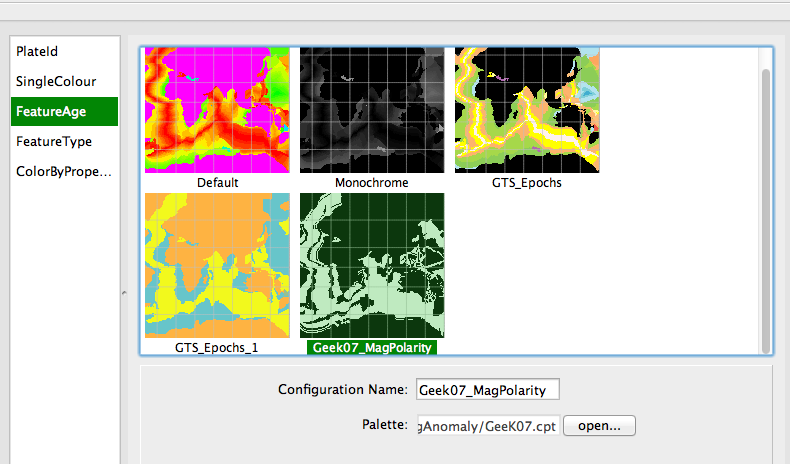
In order to color loaded features by age (and timescale) just add the color palettes to the “Draw style” settings (Features → Manage colouring) like this:
Once the new colour palettes are available, they can be assigned to the individual layers either through the layer window or through “Features → “Manage colouring”.


Discussion