meta data for this page
Graticules for plate tectonic reconstructions
TLDR:
- Downloadable graticule (
*.gpmlfile) for GPlates can be downloaded here
Plate tectonic reconstructions require to have some present-day markers so that any person reading or looking at the results can correlate the paleo plate positions and continents with present day. Things did indeed look quite a bit different back then… Usually the present-day coastlines are used a such a marker, but as sealevel has varied extensively over the geological history, displaying an Early Cretaceous reconstruction at, say 110 Million years, with present-day shorelines might be a bit misleading.
So what's the big deal about this you might ask. One key aspect of graticules is usually that they are not “features” in the sense of tangible geospatial data, but rather a “decorative” overlay. GPlates also displays a fixed graticule (the thin gray lines spaced at 30 degrees) on the globe. However, in plate tectonics, if we go back in time, we require that such lines and decorations become 'reconstructable' back through geological history. So we need data, not decorations. During the 1980's in the famous PLATES project at UTIG, a special data type called 'Gridmarks' was invented which was pretty much a set of crosshairs, centered at equally spaced increments, mimicking a graticule which could be reconstructed. Take these individual crosshairs, assign them a lifespan and a PlateID and one could simply reconstruct them as continental outlines and other geospatial features were. All worked quite happily with this concept and this old file.
When I started to work on South Atlantic plate kinematics, I realised that, albeit being quite useful, some smaller plates would simply be missed by the grid marks. Also, one would also have to reassign plate ids for any new set of polygons one is working with and sometimes a bit of an update to the way things are being done is also refreshing. The routines which were used to generate these gridmark files (in the old PLATES *.dat format) were written in Fortran and I don't have a compiled version for my OS at hand and knowing the pain associated with this exercise I opted for a writing a new routine from scratch in Python tailored for use with GPlates.
The result of this is a short script called “CreateGraticuleLines.py” in my gptools repository which borrows command line options from GMT. I'll give a brief overview about the usage. First, either clone the toolbox using the Fossil scm tool:
fossil clone https://code.paleoearthlabs.org/gptools/
or download a zipped archive (either from here or clone a downstream GIT mirror of the fossil repos from my Sourcehut repository). Open the terminal, cd to the place where you have downloaded the archive, unzip and type:
cd gptools && chmod u+x CreateGraticuleLines.py
./CreateGraticuleLines.py --help
So now you can create regular spaced graticule lines either for a global coverage at 5 degree line spacing (the default settings, equivalent to -Rd -I5) or for any other bounding box and line increment you require. For example
./CreateGraticuleLine.py -R-10/40/40/70 -I1
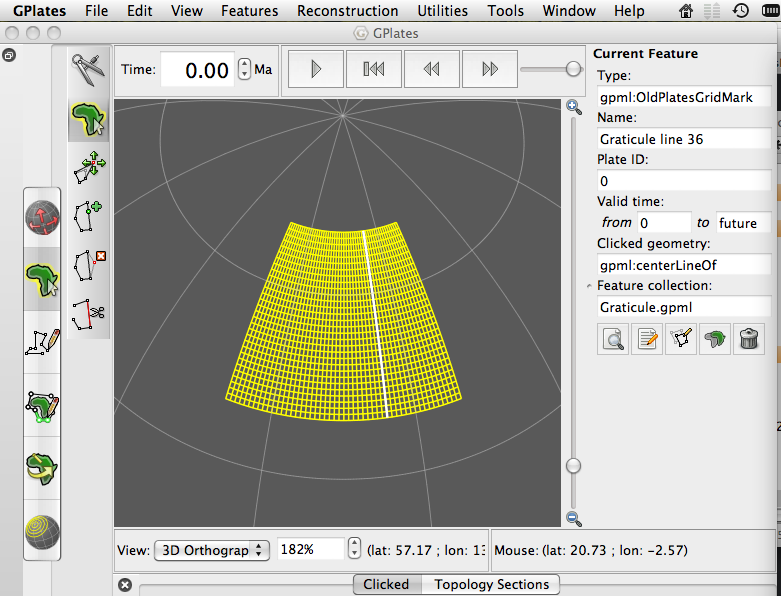
will create the following file for GPlates (by default the output name for the file is Graticule.gpml):
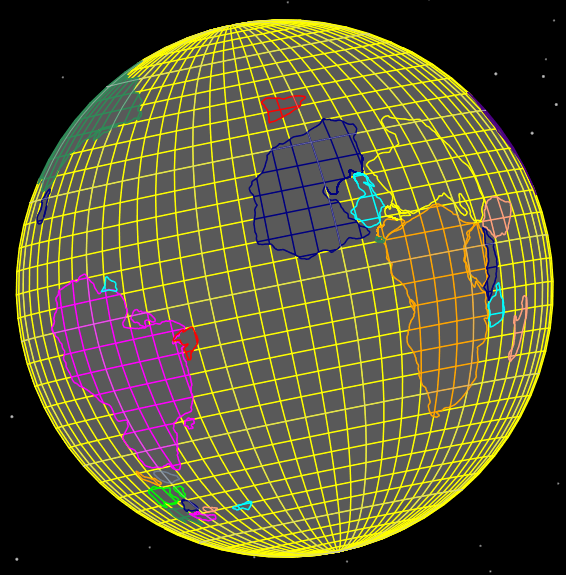
Once you load plate polygons into GPlates along with the graticule lines, you can use the cookie-cutting functionality in GPlates to cut the lines and assign individual plate IDs along with an “age of appearance” (set to 0 Ma by the script). It should then somehow look like this:
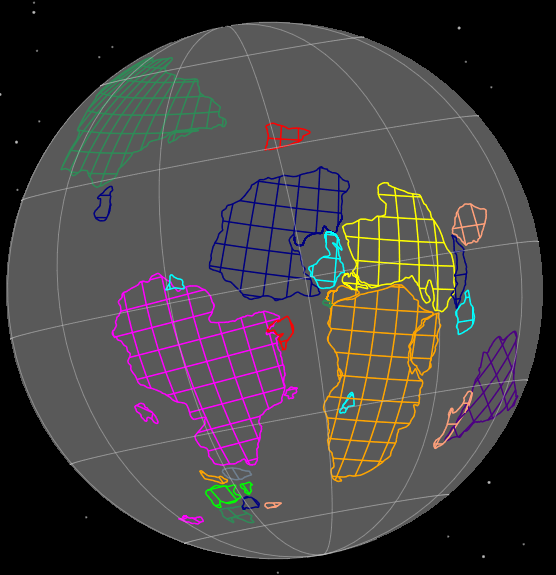
Once you have cookie-cut and age-assigned the graticule lines, you can reconstruct them like any other feature in GPlates. Note that areas without plate ID and changed ages of appearance will not display once you step back beyond 0 Ma (present day). Here's another screenshot:
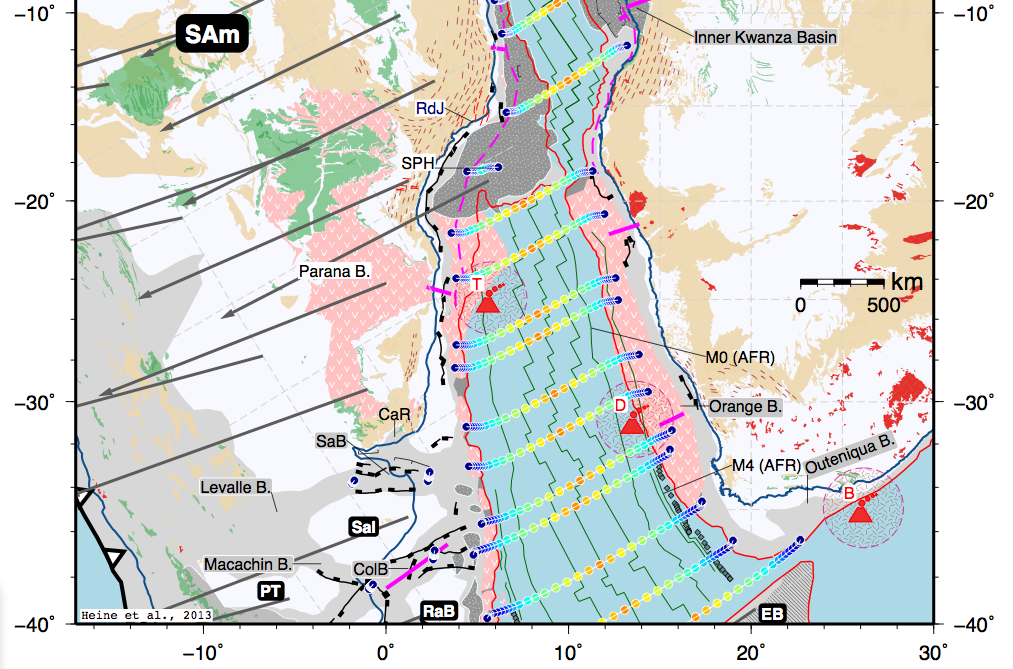
If you now export your reconstruction as set of GMT files, you can now use GMT's psxy to plot a graticule mesh on top of your reconstruction maps using various line styles. A last example from my South Atlantic maps:
Similarly, this will also work when using GPlates' SVG export. You can of course also export your graticule file in GPlates to different formats - such as ESRI Shapefile or OGR GMT plain text format (“Save as” functionality in GPlates' feature manager).
Happy map making. For bug reports and improvement suggestions please use the issue tracker or the commenting functionality here.


Discussion