meta data for this page
GPlates: Coloring features by absolute age using the Geological Time Scale colours

When making reconstructions in GPlates one often wants to colour features by their geological age. Using the colour scheme of the Geological Time Scale is a way accepted by the community to associate absolute (and stratigraphic) ages with colour. When reconstructing data in GPlates using the default FeatureAge option for styling, however, features “grow older” as the colouring is applied relative to age of the feature, depending on reconstruction age. As most geoscientists are cognitively tuned to more static maps, changing colours with age can be quite confusing. Here's a recipe to maintain constant or “absolute” age colouring in GPlates when reconstructing data.
This workaround requires to have the ColorByProperty.py script installed in the GPlates User directory so that it is available to the GPlates Draw Style editor. You will also need a color palette file (*.cpt) with the Geological Time Scale 2012 colours in GMT format which you can download from my BitBucket repository. The required file is called ''GTS2012_stages.cpt''.
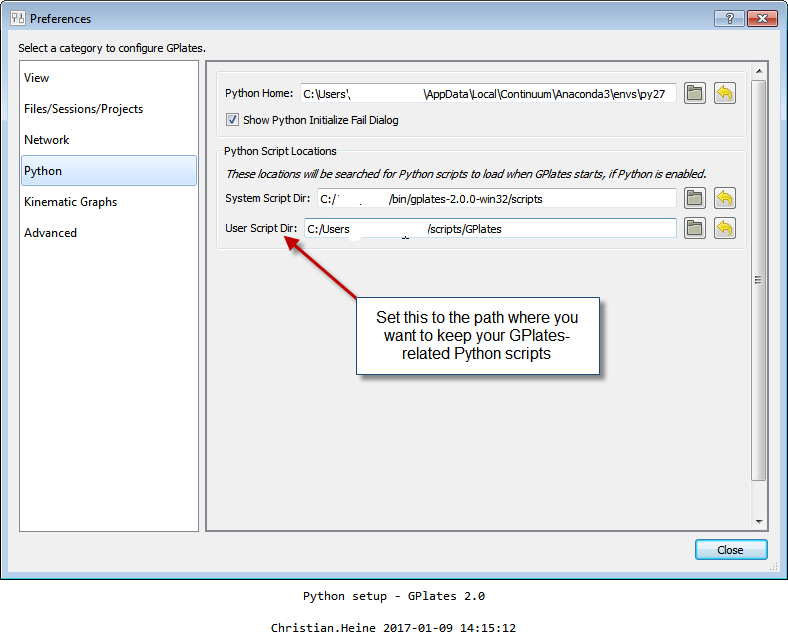
- In GPlates, open the preferences pane by pressing
CTRL + ,or go toEdit→Options. In there, select thePythoncategory. Select/create a new personal folder which will contain your GPlates-related Python scripts.
- Now, copy the below file
ColorByProperty.pyas Python script to that directory. Make sure to use a proper text editor, such as Notepad++ on Windows when dealing with such scripts. - Close GPlates
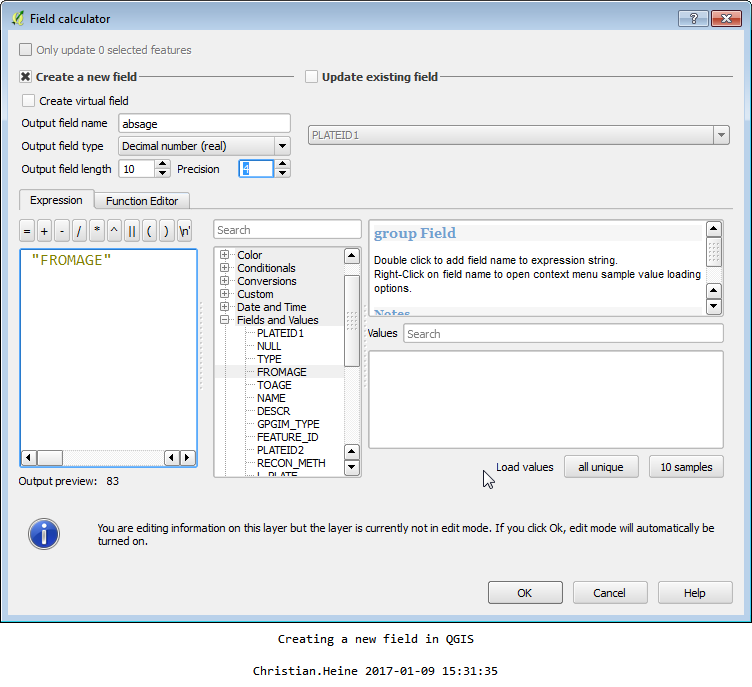
- In your GIS application of choice, open the shapefile containing the feature collection which you want to colour and add a new attribute column. As example, I am using QGIS and the
StaticPolygonsfeature collection from the GPlates Sample Data collection (SampleData→FeatureCollections→StaticPolygons→Shapefile→Muller\_etal\_AREPS\_2016\_StaticPolygons.shp). I create a new column calledabsagewhich is calculated as new field (Typereal).
- Open GPlates again, load your feature collections
- In the GPlates Layers window, click on
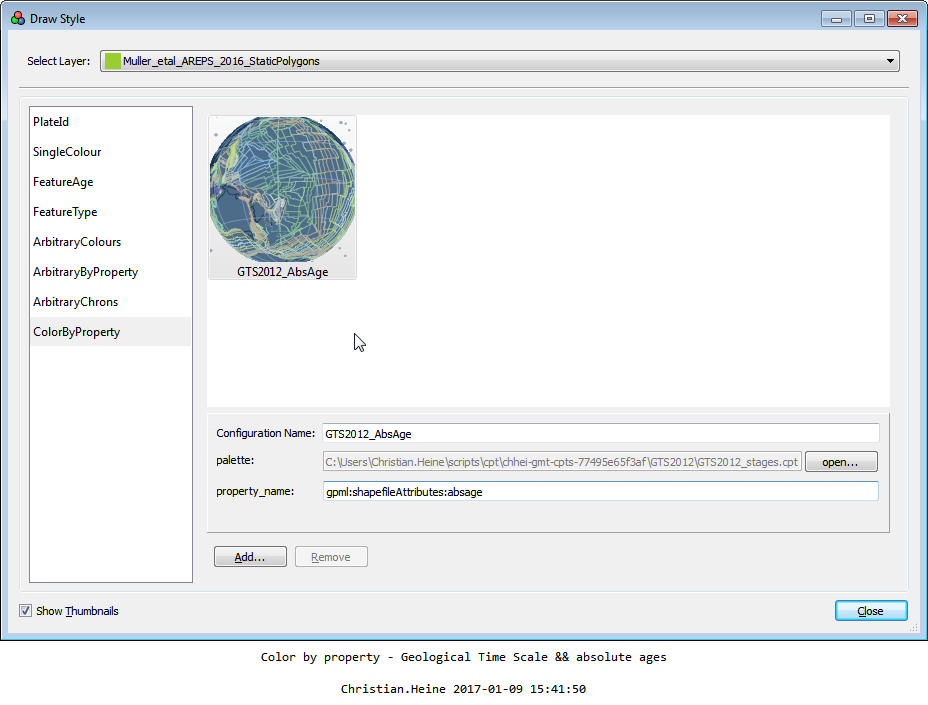
Set Draw stylefor the layer you would like to change the styling of.ColorByPropertyshould now be listed as method in the list of styling methods on the left.
- Finally, add a
Configuration Name, select thepalette(this is the GTS2012 cpt file you downloaded) and asproperty_nameputgpml:shapefileAttributes:absage. The last part of theproperty\_nameneeds to be the exact attribute name you have created in the shapefile above.
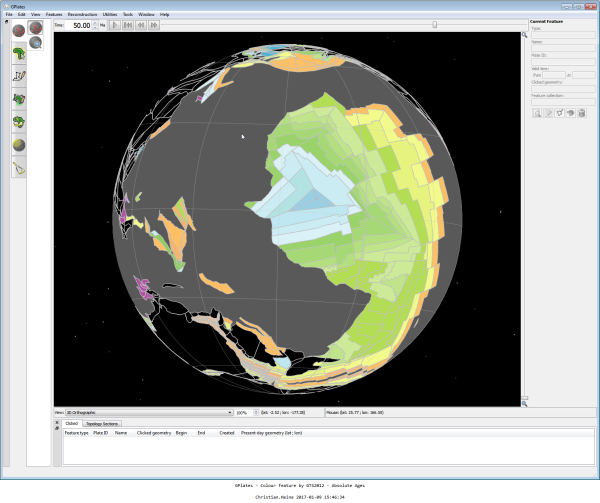
When you now start reconstructing your feature data, the colouring should remain static at any moment in your reconstruction. See this absolute reconstruction sequence for the western Pacific area at 0, 50, 100 and 150 Ma:
:tectonicwaters?gplates20_colorbyproperty_gts-absage_reconstruction*ma.png
Update
After emailing the gplates-discuss mailing list, John Cannon provided the following, tuned script to use absolute age colouring. This script also needs to be placed in one of the scripts directories (ideally the GPlates default script directory) and simplifies the colouring by absolute age by one step - it is no longer necessary to call the attribute directly as by default the FROMAGE attribute is used.
- AbsoluteAge.py
'''
Script sent to gplates-discuss mailinglist by John Cannon on 2017-01-11.
See: http://mailman.sydney.edu.au/pipermail/gplates-discuss/2017-January/000584.html

'''

import pygplates

class AbsoluteAge:
	def __init__(self):
		pass

	def get_style(self, feature, style):
		absolute_age = feature.begin_time()
		style.colour = self.cfg['Palette'].get_color(pygplates.PaletteKey(absolute_age))

	def get_config(self):
		self.cfg_dict = {}
		self.cfg_dict['Palette/type'] = 'Palette'
		return self.cfg_dict

	def set_config(self, config):
		self.cfg = config


def register():
	pygplates.Application().register_draw_style(AbsoluteAge())
Color by property
Copy the file below into your GPlates user script directory.
- ColorByProperty.py
'''
 *
 * Copyright (C) 2013 The University of Sydney, Australia
 *
 * This file is part of GPlates.
 *
 * GPlates is free software; you can redistribute it and/or modify it under
 * the terms of the GNU General Public License, version 2, as published by
 * the Free Software Foundation.
 *
 * GPlates is distributed in the hope that it will be useful, but WITHOUT
 * ANY WARRANTY; without even the implied warranty of MERCHANTABILITY or
 * FITNESS FOR A PARTICULAR PURPOSE.  See the GNU General Public License
 * for more details.
 *
 * You should have received a copy of the GNU General Public License along
 * with this program; if not, write to Free Software Foundation, Inc.,
 * 51 Franklin Street, Fifth Floor, Boston, MA  02110-1301, USA.
 *
'''

import pygplates

class ColorByProperty:
	def __init__(self):
		pass

	def get_style(self, feature, style):
		p_name = self.cfg[ 'PropertyName' ]
		if(len(p_name) == 0):
			return

		props = feature.get_properties_by_name(p_name)
		props[0]="".join(props[0].split())
		if(len(props) > 0):
			style.colour = self.cfg['palette'].get_color(pygplates.PaletteKey( props[0]) )

	def get_config(self):
		self.cfg_dict = {}
		self.cfg_dict['property_name/type'] = 'String'
		self.cfg_dict['palette/type'] = 'Palette'
		return self.cfg_dict

	def set_config(self, config):
		self.cfg = config


def register():
	pygplates.Application().register_draw_style(ColorByProperty())


Discussion